Native Linux Microcontainers
Joblet is a micro-container runtime for running Linux jobs with: Process and filesystem isolation (PID namespace, chroot) Fine-grained CPU, memory, and IO throttling (cgroups v2) Secure job execution with mTLS and RBAC Built-in scheduler, SSE log streaming, and multi-core pinning Ideal for: Agentic AI Workloads (Untrusted code)
Project maintained by ehsaniara Hosted on GitHub Pages — Theme by mattgraham
Joblet Web Admin UI
The Joblet Web Admin UI provides a comprehensive React-based interface for managing jobs and monitoring system performance. The admin UI is now available as a standalone package in the joblet-admin repository, connecting directly to the Joblet server via gRPC.
Table of Contents
- Installation
- Getting Started
- Dashboard Overview
- System Monitoring
- Job Management
- Administration Features
- Troubleshooting
Installation
Prerequisites
- Operating System: Linux, macOS, or Windows
- Node.js: 18.x or later
- Joblet Server: Running and accessible from the admin UI host
- Configuration: Valid
~/.rnx/rnx-config.ymlwith mTLS certificates
Standalone Installation
The Admin UI is now available as a separate package from the joblet-admin repository:
# Clone the joblet-admin repository
git clone https://github.com/ehsaniara/joblet-admin
cd joblet-admin

# Install dependencies
npm install

# Start the admin interface
npm run dev

# Access at http://localhost:3000
Note: The admin UI connects directly to the Joblet server via gRPC.
Production Installation
# Build the application
npm run build

# Start in production mode
npm start

# Or deploy the built files from dist/ directory
Getting Started
Launch the Admin UI
# Development mode (recommended)
npm run dev
# UI: http://localhost:3000
# API: http://localhost:5175

# Production mode
npm run build
npm start

# Development with custom ports
JOBLET_ADMIN_PORT=8080 npm run dev:server
The admin UI will be available at http://localhost:3000 by default.
First Login
- Ensure your Joblet server is running and accessible
- The admin UI automatically uses your RNX configuration for authentication
- No separate login is required - mTLS certificates handle authentication
Dashboard Overview
The admin UI consists of several main sections accessible via the navigation sidebar:
🏠 Dashboard
- System Health Overview: Quick status of server, jobs, and resources
- Recent Activity: Latest job executions and status changes
- Quick Stats: Active jobs, total jobs, system uptime
- Resource Usage Summary: CPU, memory, and disk usage at a glance
📊 System Monitoring
- Real-time Metrics: Live system performance data
- Historical Trends: Performance graphs over time
- Alert Status: System alerts and warnings
💼 Jobs
- Job List: All jobs with pagination and filtering
- Job Details: Individual job information and logs
- Job Actions: Start, stop, delete operations
⚙️ Administration
- Volume Management: Create and manage persistent storage
- Network Configuration: Custom network setup
- Runtime Management: Available runtime environments
System Monitoring
The System Monitoring page provides comprehensive real-time insights into your Joblet server performance.
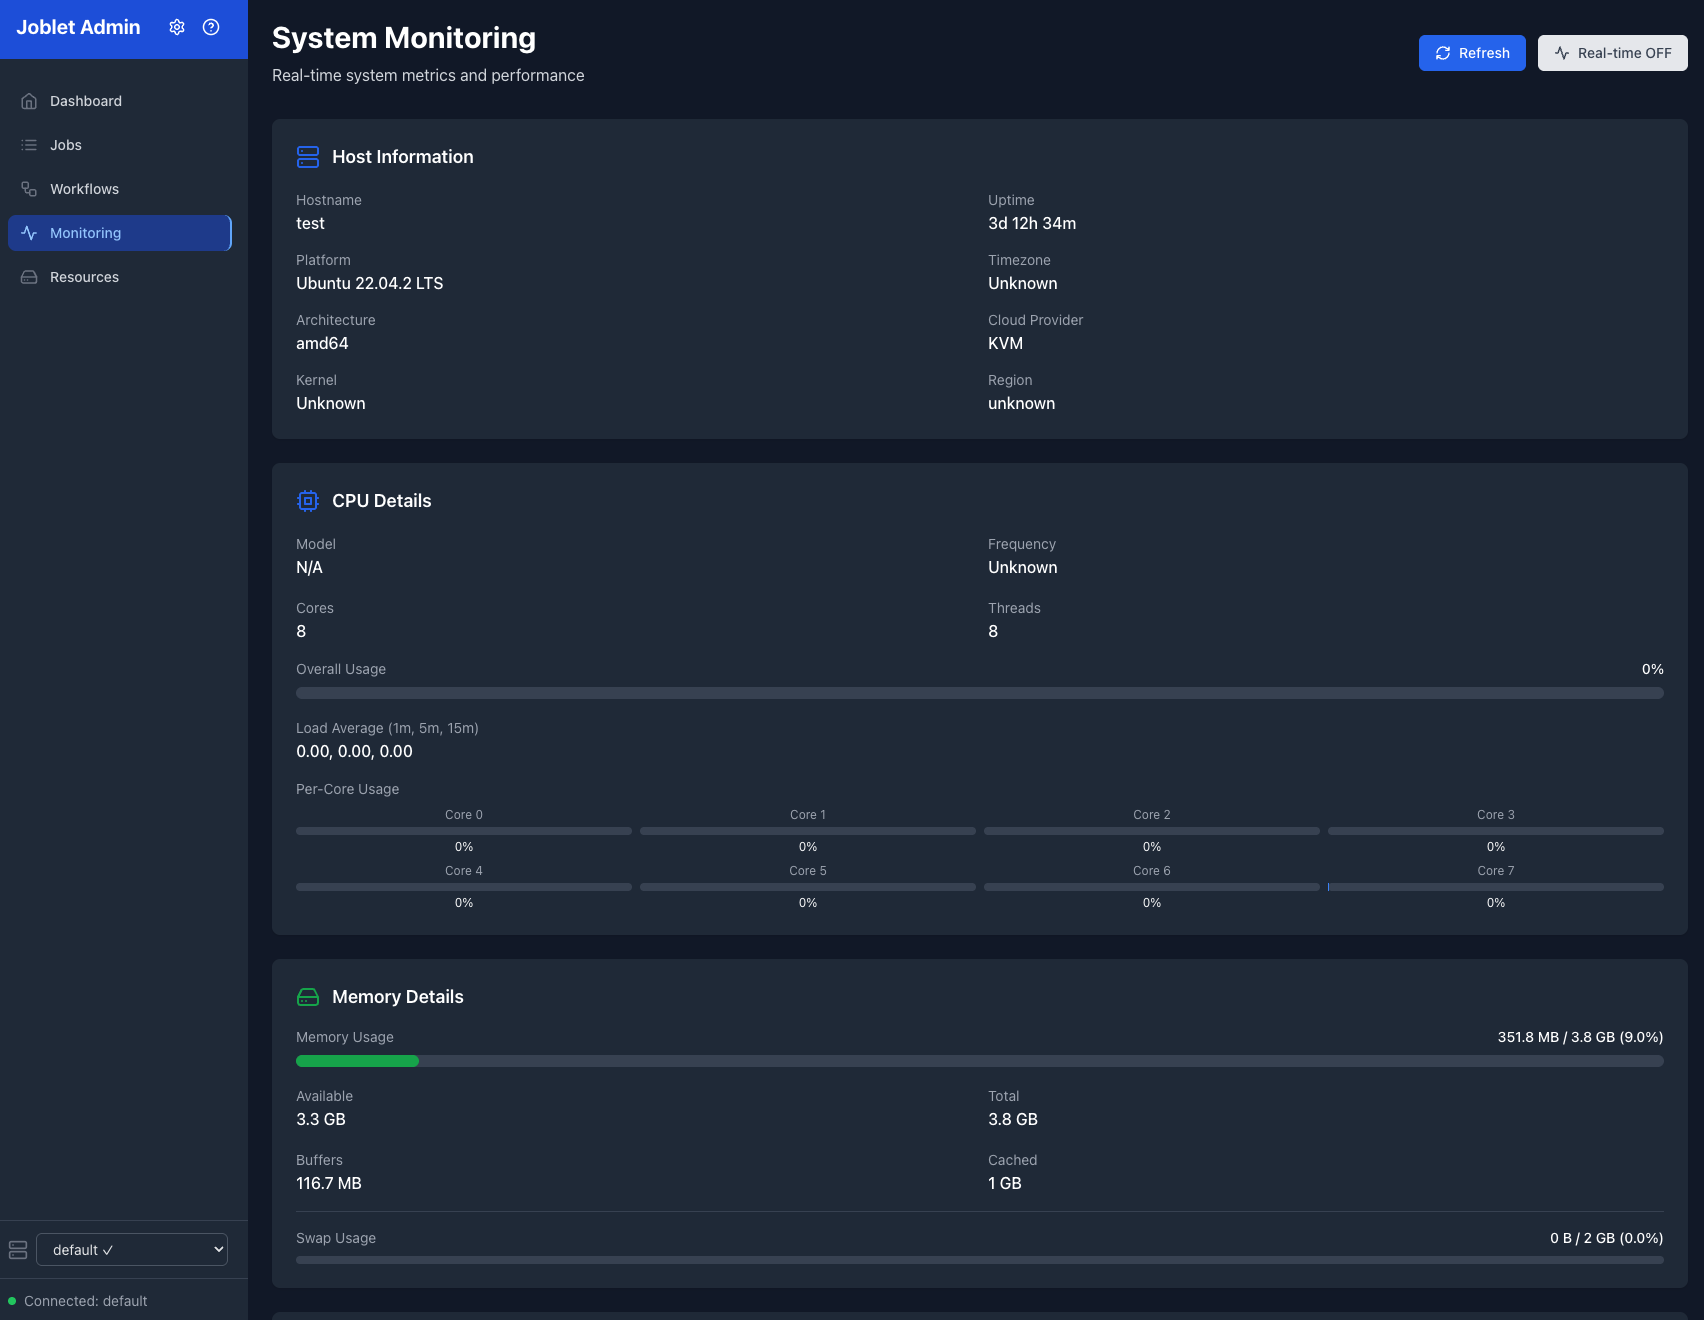 Real-time system metrics and performance monitoring dashboard
Host Information Card
Displays essential server information:
- Hostname: Server identifier
- Platform: Operating system and version
- Architecture: CPU architecture (e.g., amd64, arm64)
- Kernel Version: Linux kernel version
- Uptime: Server uptime in string format
- Cloud Environment: Cloud provider, instance type, region (if applicable)
CPU Details Card
Real-time CPU monitoring:
- CPU Model: Processor model and specifications
- Core Count: Physical and logical cores
- Overall Usage: Current CPU utilization percentage
- Per-Core Usage: Individual core utilization with visual bars
- Load Average: 1, 5, and 15-minute load averages
- Temperature: CPU temperature (if available)
Memory Details Card
Comprehensive memory monitoring:
- Total Memory: Available system memory
- Used Memory: Currently allocated memory
- Available Memory: Free memory available for allocation
- Memory Usage: Percentage utilization with progress bar
- Buffers/Cache: System buffer and cache usage
- Swap Usage: Swap space utilization (if configured)
Disk Information Card
Storage monitoring across all mount points:
- Device Information: Device names and mount points
- Filesystem Types: ext4, xfs, etc.
- Usage Statistics: Used/total space with percentage
- Color-coded Alerts: Green (normal), yellow (75%+), red (90%+)
- I/O Statistics: Read/write rates and IOPS (when available)
Network Interfaces Card
Network monitoring for all interfaces:
- Interface Details: Interface names and types (ethernet, wireless)
- Status Indicators: Up/down status with color coding
- Traffic Statistics: RX/TX bytes and packet counts
- Error Rates: Packet drops and transmission errors
- IP Addresses: Assigned IP addresses per interface
- MAC Addresses: Hardware addresses
Process Monitor Card
Real-time process monitoring:
- Top Processes: Sorted by CPU or memory usage
- Process Details: PID, name, command, user
- Resource Usage: CPU percentage and memory consumption
- Status Information: Process state (running, sleeping, etc.)
- Search and Filter: Find specific processes quickly
- Configurable Display: Show top 10, 25, or 50 processes
Interactive Features
- Real-time Updates: Toggle real-time monitoring on/off
- Manual Refresh: Force refresh system information
- Responsive Design: Optimized for desktop and tablet viewing
- Dark Theme: Professional dark interface reduces eye strain
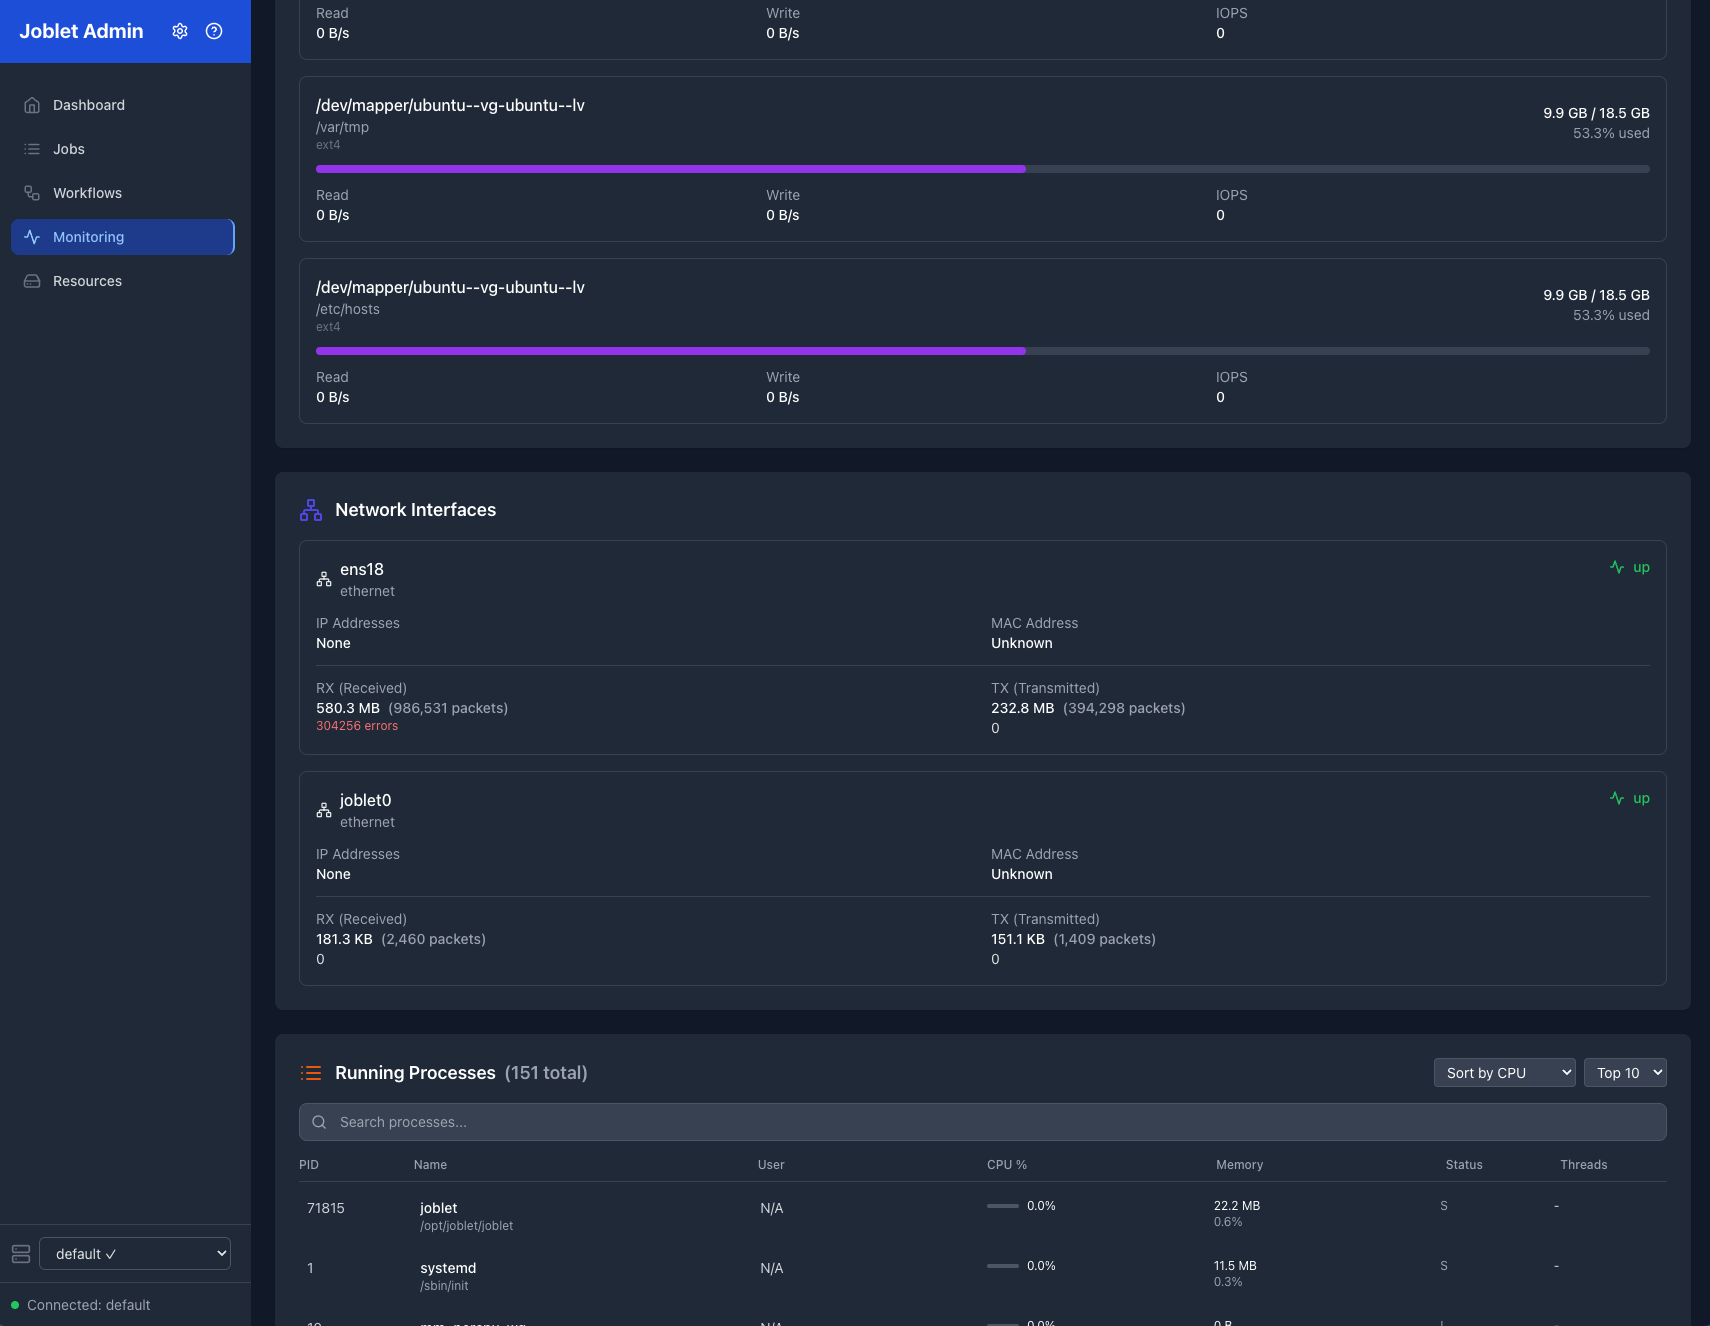 Detailed system metrics with CPU, memory, and process monitoring
Job Management
Job List View
The Jobs page provides a comprehensive overview of all job executions:
Features
- Paginated Display: Configurable page sizes (5, 10, 25, 50, 100 jobs)
- Sortable Columns: Click column headers to sort by any field
- Real-time Updates: Job status updates automatically
- Bulk Operations: Select multiple jobs for batch operations
Job Information Displayed
| Column | Description |
|---|---|
| Job ID | Unique identifier for the job |
| Status | Current execution status (running, completed, failed, etc.) |
| Command | The command or script being executed |
| Runtime | Runtime environment (if specified) |
| Network | Network configuration |
| Started | Job start timestamp |
| Duration | Execution time (for completed jobs) |
| Actions | Quick action buttons (stop, logs, delete) |
Job Status Indicators
- 🟢 Completed: Job finished successfully
- 🟡 Running: Job is currently executing
- 🔴 Failed: Job encountered an error
- ⏸️ Stopped: Job was manually stopped
- ⏳ Scheduled: Job is scheduled for future execution
Job Details View
Click on any job ID to view detailed information:
Job Information
- Execution Details: Start time, duration, exit code
- Resource Usage: CPU, memory, and disk utilization
- Configuration: Runtime, network, volumes, resource limits
- Scheduling: Schedule information (if applicable)
Real-time Logs
- Live Log Stream: Real-time output from the job
- Log History: Complete log history with timestamps
- Search and Filter: Find specific log entries
- Auto-scroll: Automatically follow new log entries
Job Actions
- Stop Job: Terminate a running job
- Restart Job: Re-execute a completed job
- Download Logs: Export logs to a file
- Delete Job: Remove job from history
Advanced Filtering
Filter jobs by various criteria:
- Status: Show only running, completed, or failed jobs
- Date Range: Filter by execution date
- Runtime: Filter by runtime environment
- Network: Filter by network configuration
- Command Pattern: Search by command text
Administration Features
Volume Management
Create and manage persistent storage volumes:
Volume Operations
- Create Volume: Specify name, size, and type
- Mount Volumes: Attach volumes to jobs
- Delete Volumes: Remove unused volumes
- Usage Monitoring: Track volume space utilization
Volume Information
- Size and Usage: Current space utilization
- Mount Points: Where volumes are currently mounted
- Access Permissions: Volume access controls
- Backup Status: Backup and snapshot information
Network Configuration
Manage custom networks for job isolation:
Network Features
- Create Networks: Define custom network configurations
- CIDR Configuration: Specify IP address ranges
- Network Isolation: Isolate job groups
- Bridge Configuration: Inter-network communication
Network Monitoring
- Active Connections: Current network usage
- Traffic Statistics: Network throughput monitoring
- Security Policies: Applied network security rules
Runtime Management
Monitor and manage runtime environments:
Runtime Information
- Available Runtimes: List of installed runtime environments
- Package Lists: Installed packages in each runtime
- Health Checks: Runtime availability and status
- Usage Statistics: Runtime utilization metrics
Runtime Actions
- Test Runtime: Verify runtime functionality
- Runtime Details: View detailed runtime information
- Update Status: Check for runtime updates
System Configuration
User Preferences
- Theme Selection: Light/dark theme options
- Refresh Intervals: Configure auto-refresh rates
- Page Sizes: Default pagination settings
- Notification Settings: Alert and notification preferences
Server Configuration
- Connection Settings: Server endpoint configuration
- Authentication: mTLS certificate management
- Security Settings: Access control and permissions
Troubleshooting
Common Issues
Admin UI Won’t Start
# Check if ports are already in use
lsof -i :3000  # UI port
lsof -i :5175  # API port

# Try different ports
JOBLET_ADMIN_PORT=8080 npm run dev:server
PORT=8081 npm run dev:ui

# Check Node.js installation
node --version
npm --version
Connection Issues
# Verify server connectivity
rnx job list

# Check configuration
cat ~/.rnx/rnx-config.yml

# Test server connection
rnx monitor status

# Check admin server logs
npm run dev:server
# Look for gRPC connection errors
Performance Issues
- Slow Loading: Increase browser cache, check network connectivity
- Memory Usage: Close unused browser tabs, restart admin UI
- Update Frequency: Reduce real-time update frequency in settings
Logs and Debugging
Admin UI Logs
# View admin server logs
npm run dev:server
# Server logs will show gRPC connection status

# View UI development logs
npm run dev:ui
# React development server logs

# Check browser console
# Open browser developer tools (F12)
# Look for JavaScript errors in console
Server-side Logs
# Check Joblet server logs
sudo journalctl -u joblet -f

# Check system resources
rnx monitor status
Getting Help
- Admin UI Issues: Report bugs
- Server Issues: Report bugs
- Documentation: Complete docs
Feature Requests
The admin UI is actively developed. To request new features:
- Check existing GitHub issues
- Create a new feature request with detailed description
- Include use cases and expected behavior
- Add mockups or wireframes if applicable
Security Considerations
Authentication
- mTLS Certificates: Uses same certificates as RNX CLI
- No Separate Login: Authentication handled by client certificates
- Secure by Default: All communication encrypted
Network Security
- Local Access: Admin UI binds to localhost by default
- Firewall: Configure firewall rules for remote access
- HTTPS: Consider reverse proxy with HTTPS for remote access
Data Protection
- No Persistent Storage: Admin UI doesn’t store sensitive data
- Session Management: Uses stateless authentication
- Audit Trail: All actions logged by Joblet server
For more information, see the main documentation or visit the GitHub repository.